Diagrams
Alignment Diagram
The Alignment Diagram draws alignments between a target (or reference) sequence (drawn in red), and query sequences. Each query sequence is represented by a line underneath the target sequence, with the alignment drawn as a box aligned to the target sequence.
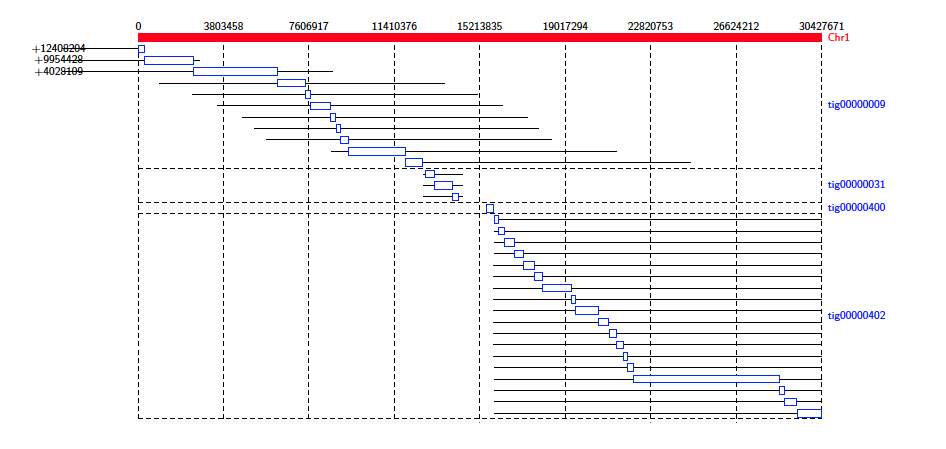
This diagram type accepts the following input formats
- paf
- psl
- coords
- tiling
- blast
and outputs the following formats
- tex
- svg.
Contig Alignment Diagram
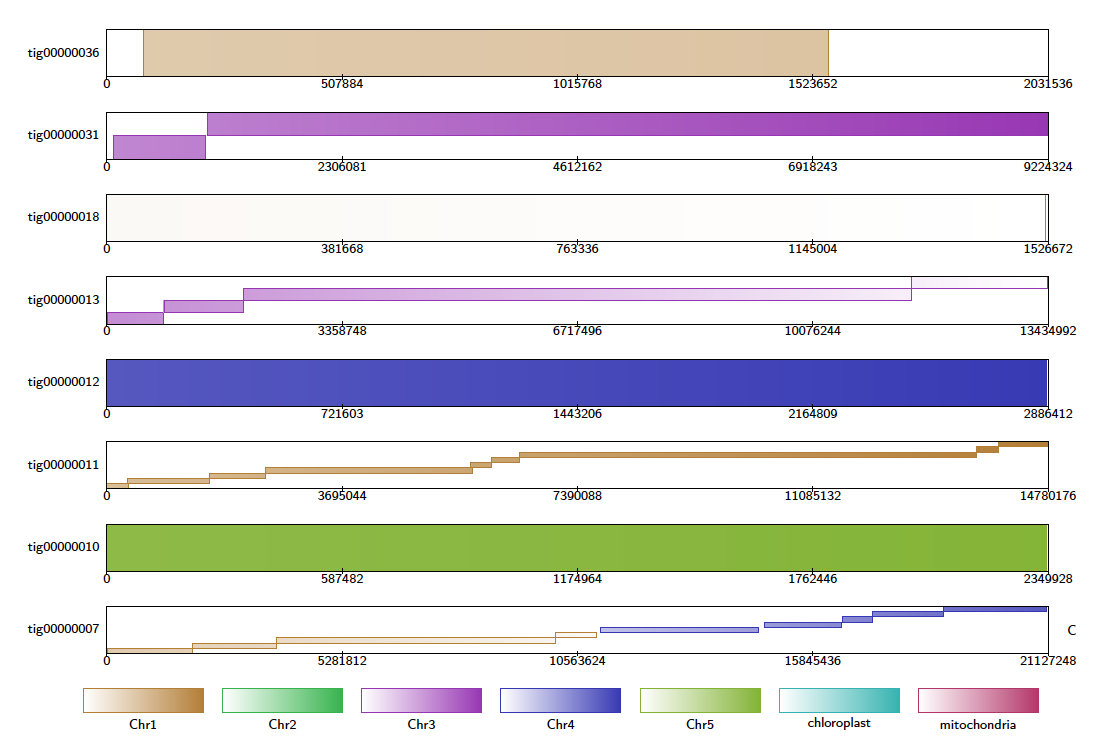
For each query contig, the Contig Alignment Diagram draws a rectangle representing the query, containing the most prominent alignments to the reference contigs. These alignments are colour coded by target contig, and shaded to give an indication of the position in the target, and the orientation of the alignment. If the -filter option is not used, only the longest 20 alignments are drawn for each query contig. Query contigs that are identified as chimeric are indicated by a “C”, as in tig00000007 below.
This diagram type accepts the following input formats
- paf
- psl
- coords
- tiling
- blast
and outputs the following formats
- tex
- svg.
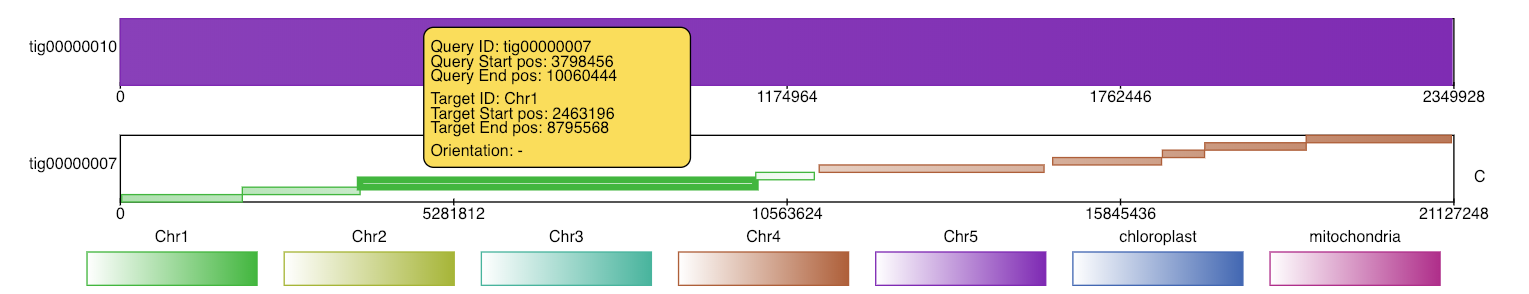
If the user chooses svg as the output format, the diagram produced contains embedded javascript to make it interactive. In an internet browser, the user may click alignments to highlight them and see further details about the alignment.
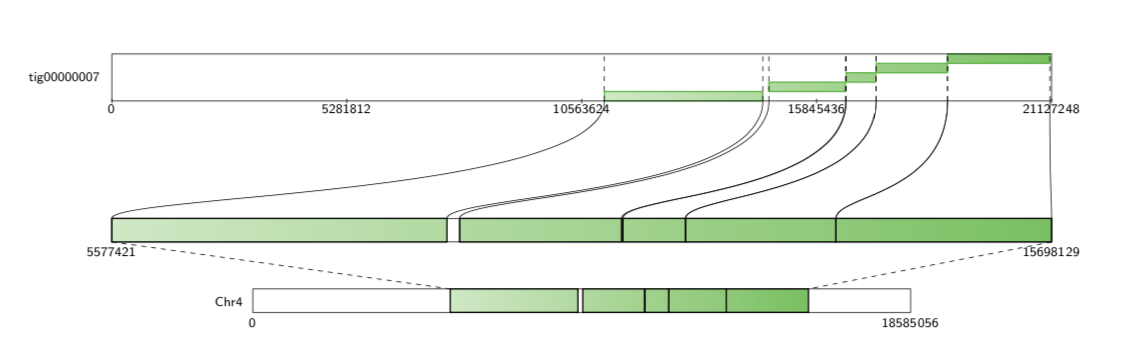
Finally, if the user specifies a query contig and a reference contig by using the -alignmentQueryName and -alignmentTargetName options, a detailed diagram containing only these alignments is produced.
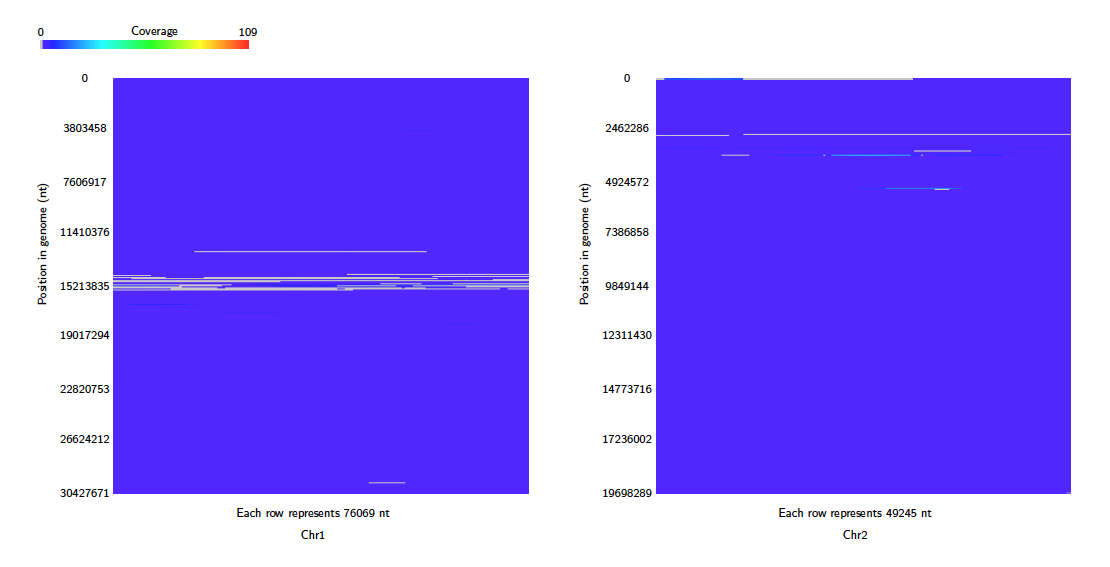
Coverage Map Diagram
Coverage of each target contig is counted by alignment for each query contig. To avoid counting the same query region multiple times, alignments with overlapping query coordinates are filtered by choosing the longest alignment. For each target contig a heatmap image is produced in which each pixel represents the coverage of a single position in the target contig. These are arranged in a tex or svg file. Note that each heatmap image is a fixed size, so the pixel scale is adjusted to fit. By default, square images are produced where the rows are read top to bottom, from left to right, as below.
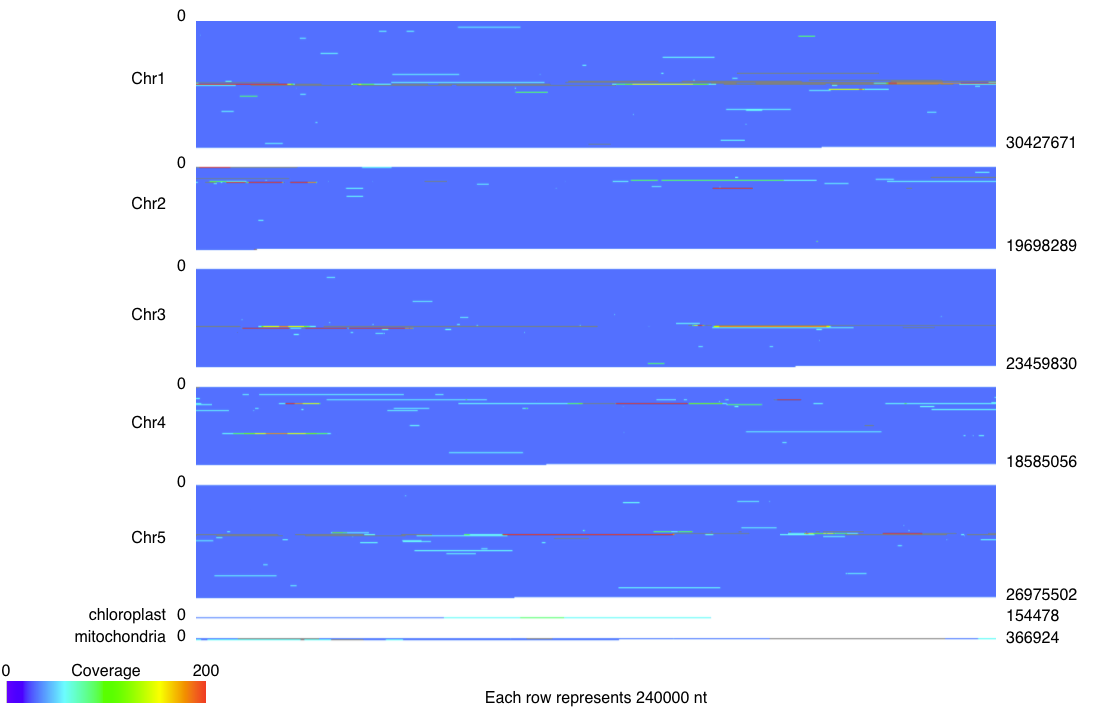
If the coverageType option is set to long, then the heatmap consists of one row for each target, read left to right.

This diagram type accepts the following input formats
- paf
- psl
- coords
- tiling
- blast
- sam
and outputs the following formats
- tex
- svg.
Genome Coverage Diagram
Alignments are binned based on their position in the target contigs, and counted to calculate the coverage of each bin. By default, the bin size is 30 bp, but this can be set using the -binsize option. As in the Coverage Map diagram, alignments that overlap in the query contig are filtered. One heatmap is produced showing the coverage over all the target contigs. Unlike the Coverage Map Diagram, the scale for the heatmaps remains the same across all the target contigs.
This diagram type accepts the following input formats
- paf
- psl
- coords
- tiling
- blast
- sam
and outputs the following formats
- svg.